


Interactive Stock Charts
คำอธิบายของInteractive Stock Charts
Annoucement: v2.81 includes new data source for AlphaVantage for international market data.
New!! Candlestick Pattern Scanner and Indicator Reliability Lab added to allow Instant backtesting!
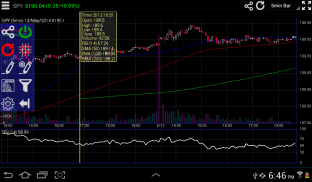
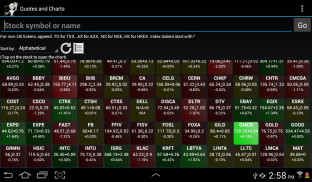
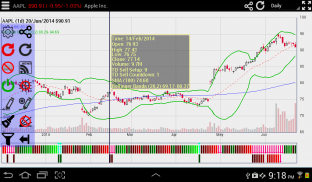
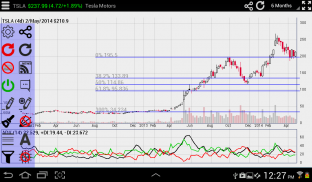
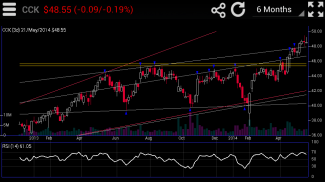
Interactive Stock Charts © is the most intuitive and advanced stock analysis charting app. You can freely adjust time frame and view technical information with touch of finger: scroll, pan and zoom on a beautiful candlestick charts with gesture and touch control. Swipe to scroll into historical analysis, pinch to zoom and change time frame, touch on price points to show detailed quotes and technical indicator values. You can also place real trade orders directly from the charts and portfolio view, through our partner Tradier Brokerage for US equity and options. Backed by Screenulator's patent pending automated chart pattern and trendline recognition engine, and industry's first 9,13 indicator completion screener! Interactive Stock Charts also comes with a powerful technical analysis tool set, Indicator Reliability Lab - in-chart backtesting tool and realtime RSS news feed to give you an edge over the market!
Using AI-based Deep Learning Neural Networks algorithms, Screenulator detects highly proftable chart patterns and reliable trendlines, TR/TD Indicators signals, as well as candlestick patterns. Backtested with 50+ years of historical big data, it ensures the you always have an edge against increasingly unpredictable markets! All Screenulator chart patterns are available on www.screenulator.com website for existing subscribers, see website for more member benefits.
Recent Additions:
Candlestick Pattern Scanner: http://www.screenulator.com/show_video.php?id=-XCcw46omgs
Indicator Reliability Lab:
About Trendlines:
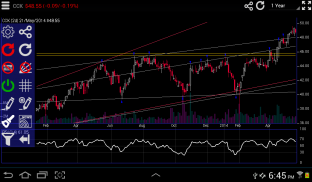
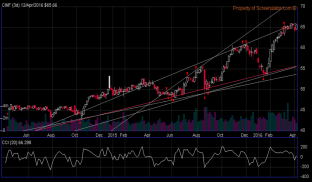
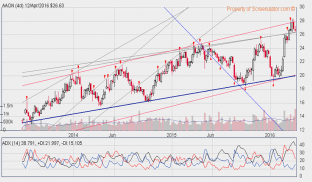
A trend line is a bounding line for the price movement of a security. A support trend line (or a bottom line) is formed when a securities price decreases and then rebounds at a pivot point that aligns with at least two previous support pivot points. Trendlines are considered by many expert traders to be the single most important tools in technical analysis. However, Support and Resistance breakout and Triangle patterns are just example of patterns formed by trendlines. This app automatically draws and screens for stocks with specific patterns.To learn more: http://www.screenulator.com/cgi-bin/v?pid=ref#trendlines
About Trend Reversal Indicator:
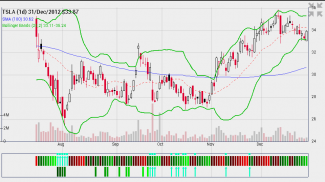
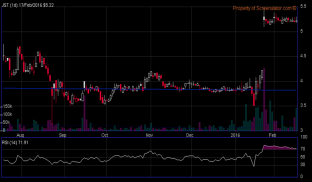
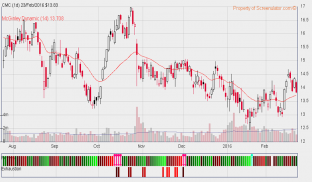
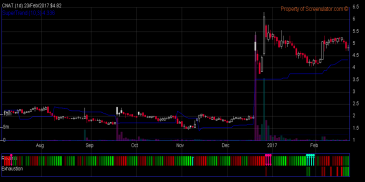
Screenulator's patent pending Trend Reversal and Exhaustion indicators combines 9,13 counting with trendline analysis to pinpoint trend pivots with color coded visual indicator. It has been shown to have an impressive record of identifying and anticipating turning points across the FX, bond, equity and commodity markets. Furthermore, the indicators provide signals not only on a daily chart but also intraday. It identifies when a trend is becoming, or has become, exhausted. This apps automatically identifies Trend Reversal, Trend Exhaustion, and Perfection criteria. It also calculates stoploss levels. To learn more: http://www.screenulator.com/show_video.php?id=TR_EXAMPLES
http://www.screenulator.com/cgi-bin/v?pid=ref#reversal
Classic TA indicators and overlays: RSI, MACD, SMA, EMA, Bollinger, Keltner band, Donchian Channel, Parabolic SAR, Ichimoku Cloud, McGinley Dynamic, SuperTrend, stochastic, ADX, Aroon, Chaikin, Ultimate, MFI, OBV, ATR, ADL, CCI indicators. Fibonacci Retracement and text annotation tools. Others will available upon requests.
Note: This app is free trial for 2 weeks or 100 usages whichever comes first.
Instruction Manual: http://www.screenulator.com/ischarts_faq.html
Desktop version: http://www.screenulator.com/ischarts_desktop.html
การแจ้งข้อมูล: v2.81 ประกอบด้วยแหล่งข้อมูลใหม่สำหรับ AlphaVantage สำหรับข้อมูลตลาดระหว่างประเทศ
ใหม่!! เครื่องสแกนเนอร์รูปแบบเชิงเทียนและตัวบ่งชี้ความน่าเชื่อถือของแล็บที่เพิ่มเพื่อให้สามารถทำ backtesting ได้ทันที!
Interactive Stock Charts ©คือแผนภูมิการวิเคราะห์สต็อกที่ใช้งานง่ายและขั้นสูงที่สุด คุณสามารถปรับกรอบเวลาได้อย่างอิสระและดูข้อมูลทางเทคนิคด้วยการแตะนิ้ว: เลื่อนแพนและซูมเข้าบนแผนภูมิแท่งเทียนที่สวยงามพร้อมด้วยท่าทางสัมผัสและการควบคุมด้วยการสัมผัส กวาดนิ้วเพื่อเลื่อนไปยังการวิเคราะห์ทางประวัติศาสตร์หยิกเพื่อซูมและเปลี่ยนกรอบเวลาสัมผัสที่จุดราคาเพื่อแสดงราคาโดยละเอียดและค่าบ่งชี้ทางเทคนิค นอกจากนี้คุณยังสามารถสั่งซื้อสินค้าจริงได้โดยตรงจากแผนภูมิและมุมมองพอร์ตโฟลิโอผ่านทาง Tradier Brokerage ของพาร์ทเนอร์สำหรับหุ้นและตัวเลือกของสหรัฐฯ ได้รับการสนับสนุนโดย Screenulator ของสิทธิบัตรที่รอดำเนินการแบบแผนภูมิอัตโนมัติและเครื่องมือการรับรู้เส้นรอบวงและ screener เสร็จสิ้นการตัวบ่งชี้ของอุตสาหกรรม 9,13! แผนภูมิหุ้นแบบอินเตอร์แอ็กทีฟยังมาพร้อมกับชุดเครื่องมือวิเคราะห์ทางเทคนิคที่มีประสิทธิภาพ Indicator Reliability Lab - เครื่องมือวิเคราะห์ข้อมูลในแผนภูมิและฟีดข่าว RSS แบบเรียลไทม์เพื่อให้คุณได้เปรียบเหนือตลาด!
การใช้อัลกอริทึมของเครือข่ายประสาทการเรียนรู้ด้วยอิเลคทรอนิคส์แบบใช้คลื่นความถี่ AI ทำให้ Screenulator ตรวจพบรูปแบบกราฟแท่งและเส้นแนวโน้มที่น่าเชื่อถือสัญญาณบอกสถานะ TR / TD รวมทั้งรูปแบบเชิงเทียน Backtested กับ 50 ปีของข้อมูลขนาดใหญ่ทางประวัติศาสตร์จะช่วยให้คุณมักจะมีขอบกับตลาดคาดการณ์ได้มากขึ้น! รูปแบบแผนภูมิ Screenulator ทั้งหมดมีอยู่ในเว็บไซต์ www.screenulator.com สำหรับสมาชิกปัจจุบันโปรดดูเว็บไซต์สำหรับสิทธิประโยชน์ของสมาชิกเพิ่มเติม
การเพิ่มล่าสุด:
เครื่องสแกนลายนิ้วมือเชิงเทียน: http://www.screenulator.com/show_video.php?id=-XCcw46omgs
ตัวบ่งชี้ความเชื่อถือได้ของห้องปฏิบัติการ:
เกี่ยวกับ Trendlines:
เส้นแนวโน้มเป็นเส้นขอบเขตสำหรับการเคลื่อนไหวด้านราคาของหลักทรัพย์ เส้นแนวโน้มการสนับสนุน (หรือบรรทัดล่าง) จะเกิดขึ้นเมื่อราคาหลักทรัพย์ลดลงและรีบาวน์ที่จุดหมุนที่สอดคล้องกับจุดหมุนสนับสนุนก่อนหน้านี้อย่างน้อยสองจุด เทรนด์ไลน์ได้รับการพิจารณาจากผู้ค้าผู้เชี่ยวชาญมากมายให้เป็นเครื่องมือสำคัญที่สุดในการวิเคราะห์ทางเทคนิค อย่างไรก็ตามการสนับสนุนและการป้องกันความต้านทานและรูปแบบสามเหลี่ยมเป็นเพียงตัวอย่างของรูปแบบที่สร้างขึ้นโดยเส้นแนวโน้ม แอปนี้จะดึงและแสดงสเกลสำหรับหุ้นโดยอัตโนมัติด้วยรูปแบบที่เฉพาะเจาะจงหากต้องการเรียนรู้เพิ่มเติม: http://www.screenulator.com/cgi-bin/v?pid=ref#trendlines
เกี่ยวกับตัวบ่งชี้การกลับรายการแนวโน้ม:
สิทธิบัตรของ Screenulator ที่รอการกลับรายการ Trend Reversal และ Exhaustion จะรวมการนับ 9,13 ด้วยการวิเคราะห์เส้นแนวโน้มเพื่อหาจุดเปลี่ยนแนวโน้มด้วยตัวบ่งชี้ภาพสี ได้รับการแสดงที่มีบันทึกที่น่าประทับใจของการระบุและคาดการณ์จุดหักเหข้ามตลาดตราสารหนี้, ตราสารทุนและสินค้าโภคภัณฑ์ นอกจากตัวบ่งชี้ที่ให้สัญญาณไม่เพียง แต่ในแผนภูมิรายวัน แต่ยัง intraday จะระบุเมื่อแนวโน้มกลายเป็นหรือกลายเป็นหมด. แอปพลิเคชันนี้จะระบุถึงแนวโน้มการกลับรายการย้อนกลับแนวโน้มอ่อนเพลียและความสมบูรณ์แบบโดยอัตโนมัติ นอกจากนี้ยังคำนวณ stoploss ระดับ หากต้องการเรียนรู้เพิ่มเติม: http://www.screenulator.com/show_video.php?id=TR_EXAMPLES
http://www.screenulator.com/cgi-bin/v?pid=ref#reversal
ตัวบ่งชี้และตัวบ่งชี้ TA แบบดั้งเดิม: RSI, MACD, SMA, EMA, Bollinger, Keltner, Donchian Channel, Parabolic SAR, Ichimoku Cloud, McGinley Dynamic, SuperTrend, Stochastic, ADX, Aroon, Chaikin, Ultimate, MFI, OBV, ATR, ADL ตัวชี้วัด CCI การเก็บข้อมูล Fibonacci Retracement และเครื่องมือบันทึกย่อข้อความ อื่น ๆ จะพร้อมใช้งานตามคำขอ
หมายเหตุ: แอปนี้ทดลองใช้ฟรีเป็นเวลา 2 สัปดาห์หรือ 100 ครั้งขึ้นอยู่กับว่าจะถึงอย่างใดก่อน
คู่มือการใช้งาน: http://www.screenulator.com/ischarts_faq.html
รุ่นเดสก์ท็อป: http://www.screenulator.com/ischarts_desktop.html
Interactive Stock Charts--เวอร์ชั่น2.86
(23-09-2020)Interactive Stock Charts - ข้อมูล APK
เวอร์ชั่น APK: 2.86แพ็คเกจ: com.screenulator.ischartsเวอร์ชั่นล่าสุดของInteractive Stock Charts
เวอร์ชั่นอื่น


แอปในประเภทเดียวกัน